Hierarchical Clustering
Hierarchical clustering is a hierarchical method that creates a clustering tree called a dendrogram. Each leaf on the tree is a data point, and branches represent the joining of clusters. We can 'cut' the tree at different heights to get a different number of clusters. This method does not require the number of clusters to be specified in advance and can be either agglomerative (bottom-up) or divisive (top-down).
PhyloClustering.hc_label — Functionhc_label(matrix::AbstractMatrix{<:Real}, n::Int64; linkage::Symbol=:ward)Get predicted labels from hierarchical clustering for a group of phylogenetic trees.
Arguments
matrix: a N * N pairwise distance Matrix.n: the number of clusters.linkage(defaults to:ward): cluster linkage function to use. It affects what clusters are merged on each iteration::single: use the minimum distance between any of the cluster members:average: use the mean distance between any of the cluster members:complete: use the maximum distance between any of the members:ward: the distance is the increase of the average squared distance of a point to its cluster centroid after merging the two clusters:ward_presquared: same as:ward, but assumes that the distances indare already squared.
Output
A Vector object with length of N containing predicted labels for each tree (the cluster it belongs to).
Example
using PhyloClustering, PhyloNetworks

# read trees with 4-taxa in Newick format using PhyloNetworks
trees = readMultiTopology("../data/data.trees");

# convert trees to Bipartition foramt and embed them via split-weight embedding
trees = split_weight(trees, 4);
200×7 Matrix{Float64}:
2.073 2.073 2.492 7.764 0.419 0.0 0.0
1.084 1.084 2.035 6.046 0.95 0.0 0.0
1.234 1.234 2.1 6.221 0.865 0.0 0.0
2.457 2.064 2.064 6.042 0.0 0.0 0.393
1.692 1.692 2.836 5.67 1.144 0.0 0.0
2.664 2.774 2.664 6.598 0.0 0.11 0.0
1.085 1.085 2.172 5.879 1.087 0.0 0.0
1.78 1.78 2.054 6.221 0.273 0.0 0.0
2.123 2.083 2.083 8.856 0.0 0.0 0.04
1.155 1.155 2.113 7.139 0.959 0.0 0.0
⋮ ⋮
0.663 0.663 3.492 3.492 3.853 0.0 0.0
1.607 1.607 3.59 3.59 3.143 0.0 0.0
0.887 0.887 3.826 3.826 3.513 0.0 0.0
1.053 1.053 3.206 3.206 4.783 0.0 0.0
0.592 0.592 3.322 3.322 7.53 0.0 0.0
0.718 0.718 3.335 3.335 5.665 0.0 0.0
1.46 1.46 3.241 3.241 3.417 0.0 0.0
0.709 0.709 3.71 3.71 4.774 0.0 0.0
1.113 1.113 3.402 3.402 5.019 0.0 0.0Standardize the data, calculate the distance matrix, and input them into Yinyang K-means clustering.
tree = standardize_tree(trees);
matrix = distance(tree);
label = hc_label(matrix, 2)
200-element Vector{Int64}:
1
1
1
1
1
1
1
1
1
1
⋮
2
1
2
2
2
2
1
2
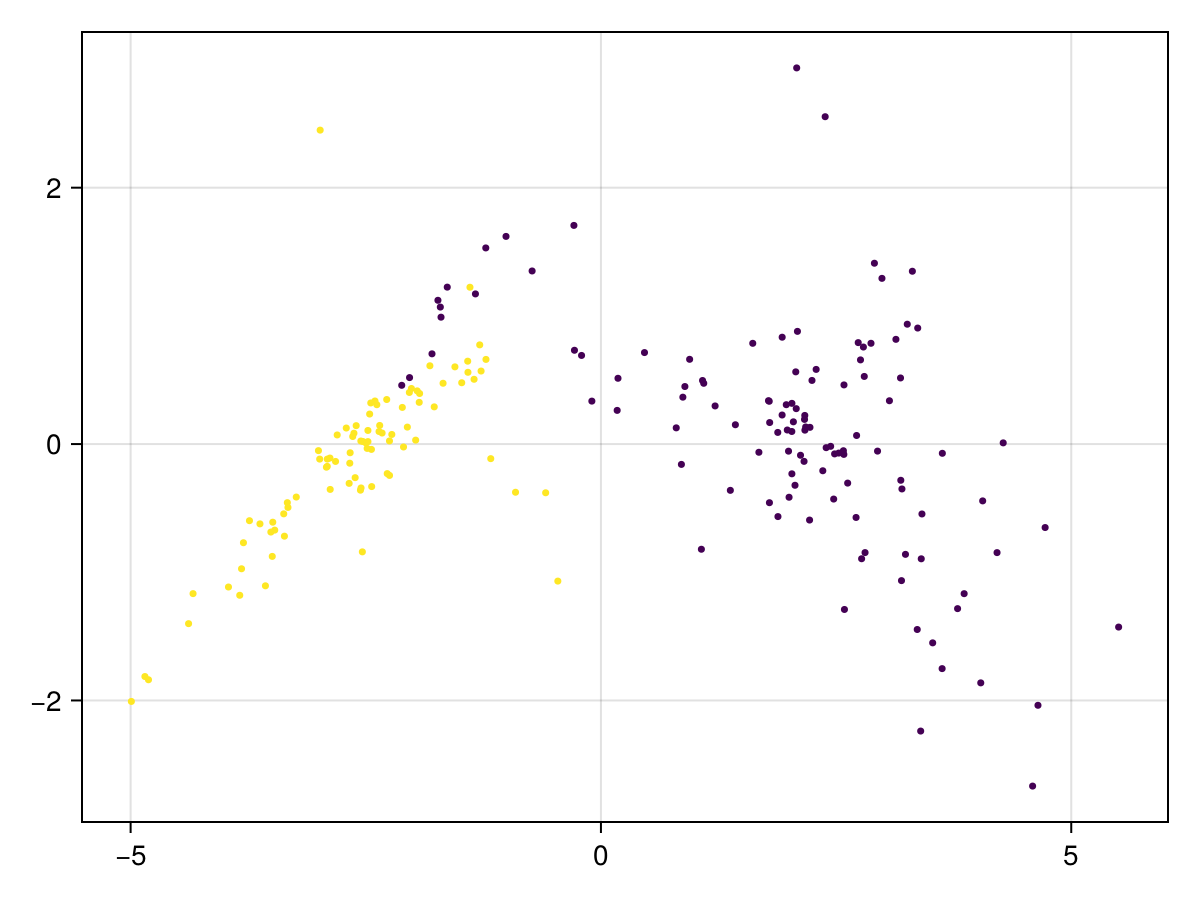
2We can visualize the result using build-in function plot_clusters.
plot_clusters(trees', label)
Reference
The implementation of hierarchical clustering is provided by Clustering.jl.
Joe H. Ward Jr. (1963) Hierarchical Grouping to Optimize an Objective Function, Journal of the American Statistical Association, 58:301, 236-244, DOI: 10.1080/01621459.1963.10500845